The New York Subway system also known as the MTA is a highly outdated and probably the most complex subway system in the world. Trying to make applications that help commuters get through this complicated network of rails is even more complicated than learning how to navigate this tricky rail network.
What Data is Available?
Unfortunately real time data from the MTA is quite scant. For what ever reason in the age of information the MTA has only saw fit to equip the 1-6 and ‘L’ routes with sensors and shared that information with the public and even then arrival predictions are usually off by at least a minute. Meanwhile in Tokyo several millions are transported to/from 197 stops so timely and reliably that they give you late passes to prove to your boss that the trains were the reason you were late.
Back here in New York, predicting the arrival and departure times of all the trains is very difficult if not impossible depending on how accurate you want to be. That is the problem my team of developers from the Flatiron School and I are hoping to solve with our app codenamed: SubWaze.
Waze for SubWaze
As our codename implies SubWaze is an app that hopes to tackle the lack of real-time data in the New York Mass Transit network by adapting the techniques the wildly popular driving/navigation app Waze uses to collect crowd-sourced data about our road networks to improve the driving experience for everyone using the app. By encouraging users to report everything from speed-traps, to accidents and potholes and having other users verify or disprove those claims Waze has managed to create extremely detailed and constantly changing roadmaps that allows the app to warn you about said speed-traps, accidents and potholes before you run into them. I’m sure by now they’ve saved me at least one or two speeding tickets. Anyways, our app hopes to take this same concept and apply it to our city’s highly frustrating public transportation network and make better notifications of service changes, delays and give people the best real-time routes they can take to get through our great city.
The first stumbling block we’ve encountered was how to acquire all of the MTA’s timetables and what real-time data that they do provide. The real-time data will be covered later as the techniques used to download, decode, and parse the data are a little bit different than the static time-tables for all trains’ expected departure and arrival times at all stations.
GTFS
Google lead the quite possibly first large and organized effort to create a standard protocol for encapsulating a transportation network’s data. Their end result is called GTFS or General Transit Feed Specification.
The MTA implementation of GTFS
The MTA follows the GTFS standard for the most part. It uses a lot of the same conventions of language, and the same CSV files. They provide almost no documentation to these files and doesn’t even bother to mention that they follow the GTFS model nor that they differ in a few tricky places. Here I will hope to clarify how to use the data they provide in case you need this information for your own applications.
A word about language
This data becomes much easier to understand when you learn the naming conventions that this data follows. A route is the collection of stops that are linked together, for example here in New York the ‘1’, ‘N’, ‘L’, etc. are all different routes. Stops are, in the case of New York subways, places like Union Square, Bowling Green, Bedford Ave., etc. that a subway or bus or railway will stop at to pick up and drop off passangers. Trips are the numerous travels a train will take from its starting stop (not necessarily the same as the route starting stop) to its ending stop (again not necessarily the same as a route’s) that are separated by the stop_times that they have at each stop. Stop_times are the most important data element that they give you because they relate different stops to different trips and by association different routes. A stop_times are the list of times that a trip arrives and departs from a particular stop.
A Database Comes To Mind
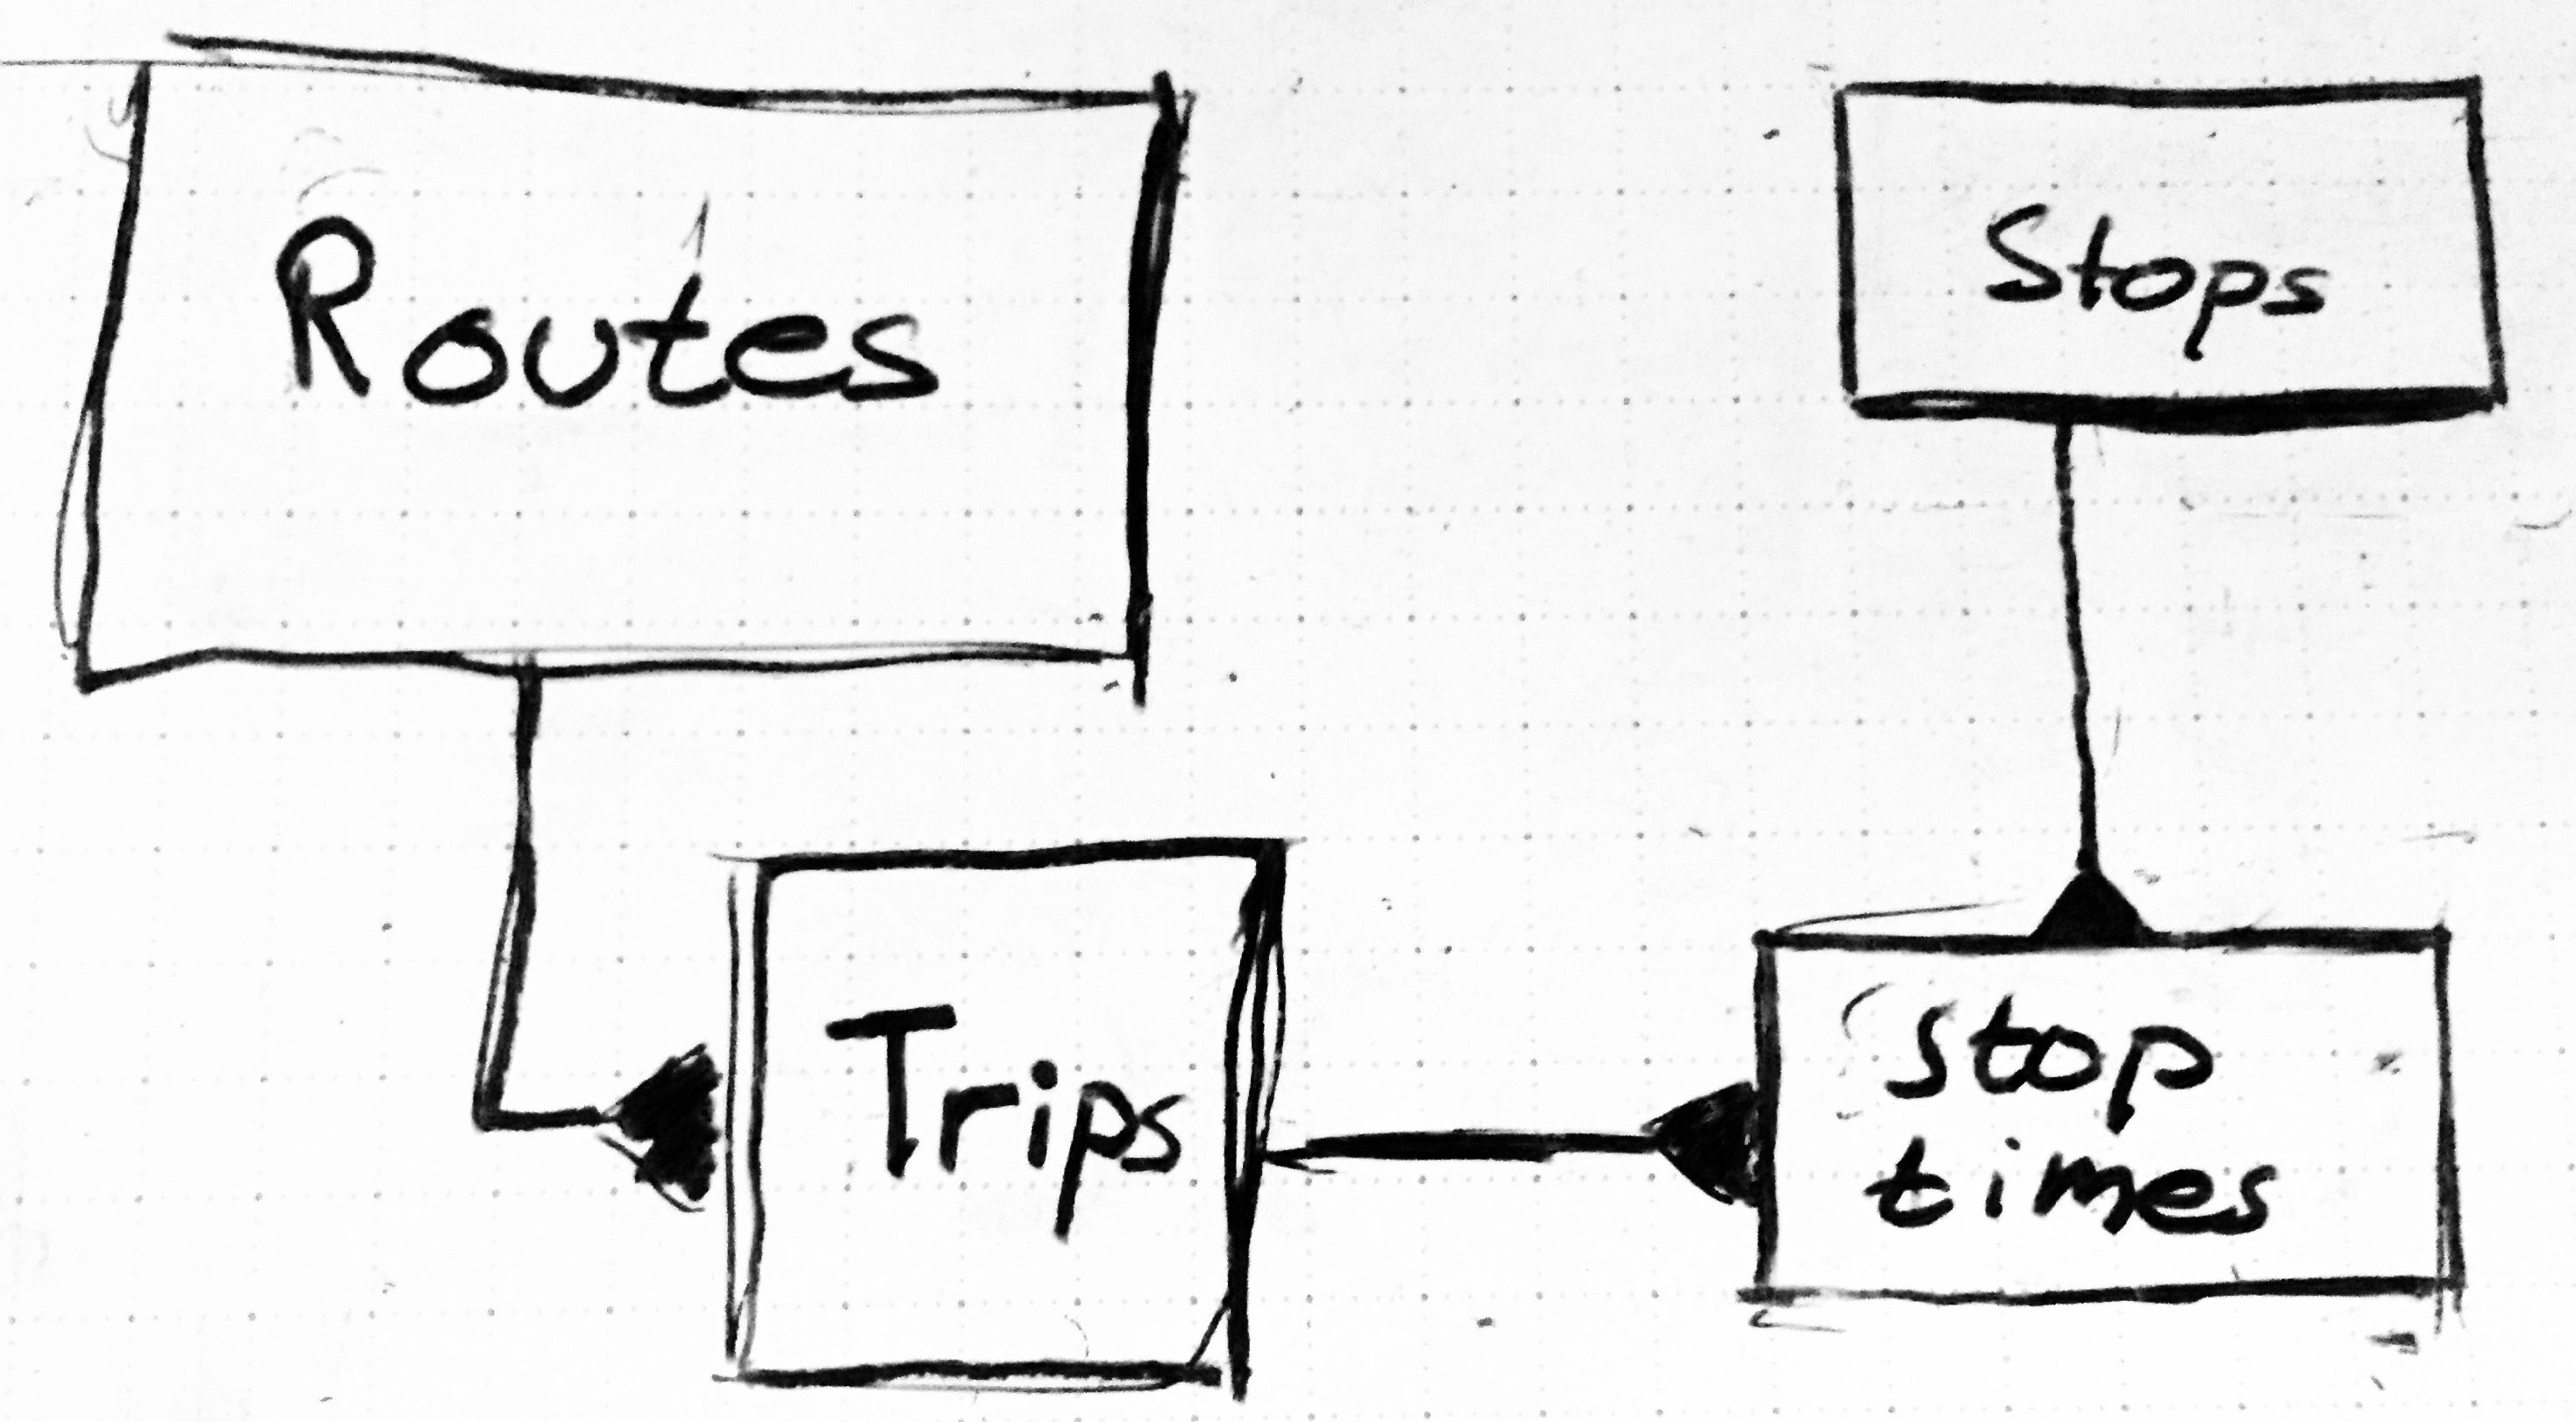
As this language starts becoming clearer a certain relational database model starts to become more clear and the one we’ve implemented in our app is detailed in the diagram above.
MTA Data Model Relationships – Note: Triangles indicate that there are many objects connected in the relationship. So for routes there are several trips related to one route.
routes.csv
- route_id
- The id used to find what route a trips object relates to
- agency_id
- Should always be MTA_NYCT probably unimportant
- route_short_name
- route_long_name
- route_desc
- route_type
- almost always ‘1’ with exception of the Staten Island Railway
- route_url
- url leading to a pdf with the route’s information
- route_color
- A hexadecimal describing the color associated with the route, i.e the 4 is green
- route_text_color
- hexadecimal associated with the text color used to display the name of the route
- most of these entries are blank, and three are ffffff
- it is probably safe to ignore this value
trips.csv
- route_id
- links with the route_id of routes.cvs above
- many trips belong to one route_id
- service_id
- we don’t care about this field….?
- trip_headsign
- The final stop on the trip, think of the headsign you’d see on the train to determine if you’re – getting on the train going in the right direction
- direction_id
- a ‘1’ or ‘0’
- consider it a boolean
- used to indicate which direction the train taking the current trip is going
- block_id
- empty
- shape_id
- the unique identifier that relates this particular trip to the shape objects that trace out the path the this trip takes on a map
stops.csv
- stop_id
- the ID for the stop along a subway line
- there’s three for each subway stop
- one that is general
- one that is northbound
- one that is southbound
- although there’s these three versions they all refer to the same station
- the first number/letter refers to the subway line the stop belongs to
- The last character refers to south or north bound or if it is a generic stop
- stop_code
- empty
- stop_name
- The official name of the stop, this would be the strings we’d want to use for to let the user select stops
- stop_desc
- empty
- stop_lat
- the latitude of the stop
- stop_lon
- the longitude of the stop
- zone_id
- empty
- stop_url
- empty
- location_type
- ‘1’ or ‘0’
- should be a boolean
- 1 or YES for generic tops which is treated as a parent for the north or south types
- 0 or NO for the stops that specify north or southbound trips
this distinction becomes clear in the next data field
- parent_station
- empty if it is a parent stop or the previous field ‘location_type’ is 0
- if the previous field is 1, it simply uses the stop_id of the parent stop
stop_times.csv
- trip_id
- the identifier that links the stop_time to a specific trips object
- there’s definitely hints about trip information embedded within the trip_id, but I haven’t taken – time to decipher it yet, might not be a valuable use of time?
- arrival_time
- the train’s arrival time at a specific stop in “HH:MM:SS” format
- departure_time
- the train’s departure time at a specific stop in “HH:MM:SS” format
- stop_id
- the identifier that links this stop time with a specific stop from the above file
- remember the first character indicates what route this belongs to
- the last character relates to whether it is a ‘N’ northbound train or a ‘Southbound train
- stop_sequence
- haven’t confirmed this yet, but I believe this relates to the order of which the stop belongs along the route
- Number starts at 1 not 0
- stop_headsign
- empty
- pickup_type
- not sure yet
- either ‘1’ or ‘0’ and no idea what they mean
- probably unimportant for us
- drop_off_type
- same as above
- shape_dist_traveled
- the segment distance traveled between stops, unfortunately it is empty
- unimportant for our app, but would be interesting data
shapes.csv
The massive list of coordinates that make up the path a route takes through the city
Thanks for listening, I hope you’ll give credit to any work me and my partners have lead you towards. Please leave comments if you liked the article, or even if you hated it, we are constantly learning. And as always…
Live Long And Prosper
Mark Haus
